
Crowdsec integration with Suricata and Pushover notifications
In this post I will walk you through the steps of integrating Suricata with Crowdsec, having the alerting and detection made in Suricata and the decision making in Crowdsec. Since Crowdsec also has a nice Cloud Console we can further visualize the alerts / decisions made, there. I will also show you how to integrate Crowdsec with Pushover so you get notified each time the Crowdsec Engine makes a decision.
The OPNSense Crowdsec plugin that you install is observing a few default logs from OPNSense, but does not come configured for any Suricata log listening. A CrowdSec Acquis.yaml file must becreated or modified to get the feature we are adding to work. Without this, the fast.log file will go unobserved, you will also need the CrowdSec Hub elements, in this case Crowdsec Suricata Collection to enable the parsing/alerting and decision making for Suricata. ssh into the OPNSense and enter the bellow commands. Presuming you already have the Crowdsec plugin and engine up and running you can skip the first command.
Prerequisites
Ensure you have:
- CrowdSec plugin installed on OPNSense.
- Suricata configured with fast logs.
Commands
- Enroll your CrowdSec engine (if not already done):
sudo cscli console enroll <key>
- Install the necessary collections and whitelist:
The below commands will add the Crowdsec Suricata Collection and whitelists preventing from getting yourself blocked.
cscli collections install crowdsecurity/suricata
cscli collections install crowdsecurity/whitelist-good-actors
cscli parsers install crowdsecurity/whitelists
Configure CrowdSec for Suricata
If the following file does not exist, create it and add the following config to it:
- /usr/local/etc/crowdsec/acquis.d/suricata.yaml
---
filenames:
  - /var/log/suricata/fast.log
labels:
  type: suricata-fastlogs
---
Configure Fast Logs and Log Rotation
Now that CrowdSec is aware and listening, we will want to create, and rotate those fast.log logs. Let’s setup the rotation of ‘/var/log/suricata/fast.log’ as a custom config:
# logfilename [owner:group] mode count size when flags [/pid_file] [sig_num]
/var/log/suricata/fast.log root:wheel 640 3 * $D0 BZ /var/run/suricata.pid 1
In order for fast.logs to work, I added the below config to the following two locations into custom.yaml
- /usr/local/opnsense/service/templates/OPNsense/IDS/custom.yaml
- /usr/local/etc/suricata/custom.yaml
%YAML 1.1
---
default-log-dir: /var/log/suricata/

outputs:
  - fast:
      enabled: yes
      filename: fast.log
      append: yes

  - eve-log:
      enabled: yes
      filetype: regular
      filename: eve.json
      types:
        - alert:
            tagged-packets: yes
        - anomaly:
            enabled: yes
        - drop:
            alerts: yes
            flows: start
        - dns:
            enabled: yes
        - tls:
            enabled: yes
        - http:
            enabled: yes

  - stats:
      enabled: yes
      filename: stats.log
      append: yes
      totals: yes

  - syslog:
      enabled: no
      facility: local5
      level: Notice
I am still testing the workflow, but this is the configuration that has worked for me to be persistant after reboot and have both fast.log and eve.json in the same time, and still see the alerts in opnsense in the Suricata alerts tab. Others have tested and specified that you need to add the whole output of the suricata.yaml to the custom.yaml but for me for some reason this did not work.
Edit: The above config will lead to a very noisy “eve.json” file A user from Suricata forum would recommend you not set those to enabled, and instead enable in the app-layer - protocols area.
%YAML 1.1
---
outputs:
  - fast:
      enabled: yes
      filename: fast.log
      append: yes
  - eve-log:
      enabled: yes
      filetype: regular
      filename: eve.json
      metadata: yes
      pcap-file: false
      community-id: true
      community-id-seed: 0
      types:
        - alert:
            payload: no
            payload-printable: no
            packet: no
            http-body: no
            http-body-printable: no
            tagged-packets: yes
            metadata:
              app-layer: true
              flow: true
              rule:
                metadata: true
                raw: true
            xff:
              enabled: yes
              mode: overwrite
              deployment: reverse
              header: X-Forwarded-For
        - frame:
            enabled: no
        - anomaly:
            enabled: no
            types:
              applayer: no
  - stats:
      enabled: yes
      filename: stats.log
      append: yes
      totals: yes
app-layer:
  protocols:
    telnet:
      enabled: yes
    rfb:
      enabled: yes
      detection-ports:
        dp: 5900, 5901, 5902, 5903, 5904, 5905, 5906, 5907, 5908, 5909
    mqtt:
      enabled: yes
    krb5:
      enabled: yes
    bittorrent-dht:
      enabled: yes
    snmp:
      enabled: yes
    ike:
      enabled: yes
    tls:
      enabled: yes
      detection-ports:
        dp: 443
      ja3-fingerprints: auto
    pgsql:
      enabled: yes
      stream-depth: 0
      max-tx: 1024
    dcerpc:
      enabled: yes
    ftp:
      enabled: yes
    rdp:
    ssh:
      enabled: yes
    http2:
      enabled: yes
    smtp:
      enabled: yes
      raw-extraction: no
      mime:
        decode-mime: yes
        decode-base64: yes
        decode-quoted-printable: yes
        header-value-depth: 2000
        extract-urls: yes
        body-md5: no
      inspected-tracker:
        content-limit: 100000
        content-inspect-min-size: 32768
        content-inspect-window: 4096
    imap:
      enabled: detection-only
    smb:
      enabled: yes
      detection-ports:
        dp: 139, 445
    nfs:
      enabled: yes
    tftp:
      enabled: yes
    dns:
      tcp:
        enabled: yes
        detection-ports:
          dp: 53
      udp:
        enabled: yes
        detection-ports:
          dp: 53
    http:
      enabled: yes
      libhtp:
         default-config:
           personality: IDS
           request-body-limit: 100kb
           response-body-limit: 100kb
           request-body-minimal-inspect-size: 32kb
           request-body-inspect-window: 4kb
           response-body-minimal-inspect-size: 40kb
           response-body-inspect-window: 16kb
           response-body-decompress-layer-limit: 2
           http-body-inline: auto
           swf-decompression:
             enabled: no
             type: both
             compress-depth: 100kb
             decompress-depth: 100kb
           double-decode-path: no
           double-decode-query: no
         server-config:
    modbus:
      enabled: yes
      detection-ports:
        dp: 502
      stream-depth: 0
    dnp3:
      enabled: yes
      detection-ports:
        dp: 20000
    enip:
      enabled: yes
      detection-ports:
        dp: 44818
        sp: 44818
    ntp:
      enabled: yes
    quic:
      enabled: yes
    dhcp:
      enabled: yes
    sip:
      enabled: yes
- cat /var/log/suricata/fast.log
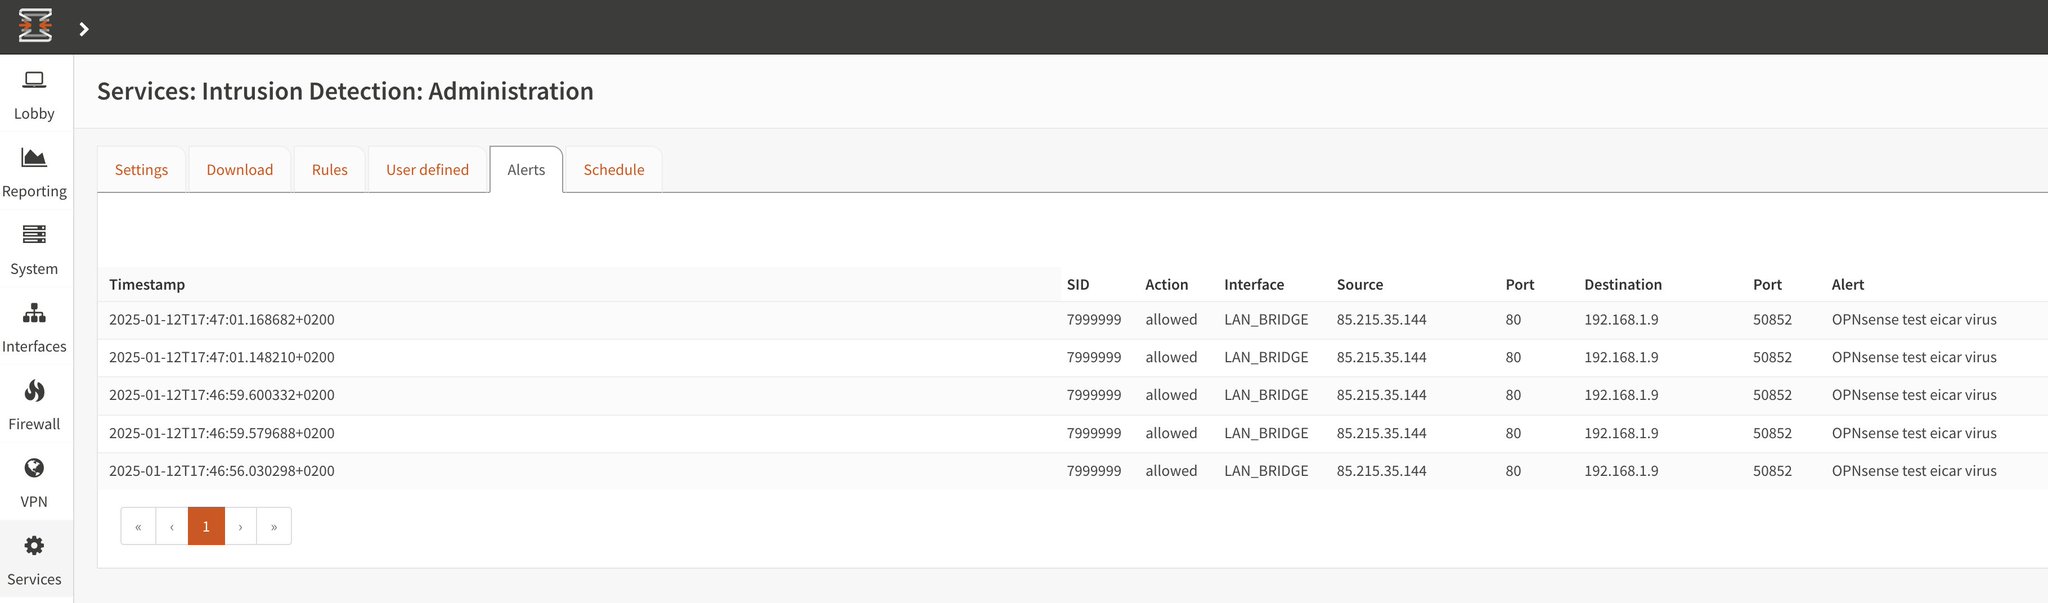
You can test the implementation with EICAR
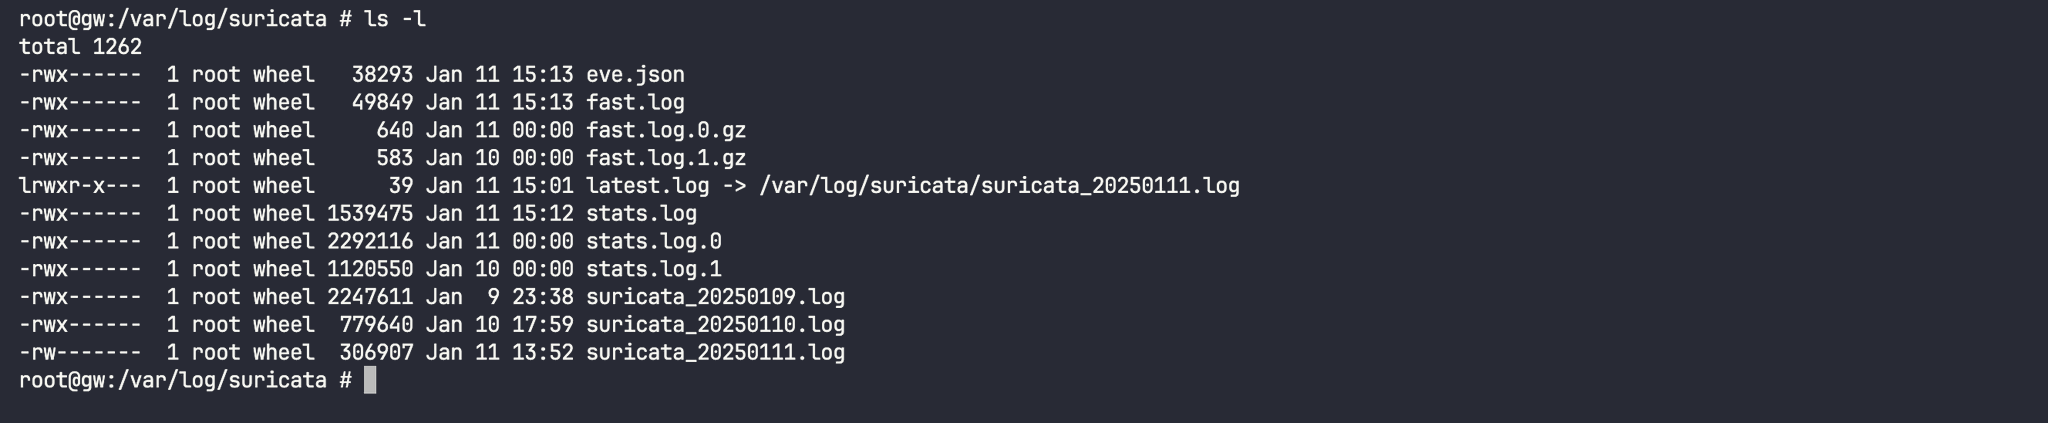
- The fast.logs should now appear and they should fill with friendly readable allerts:
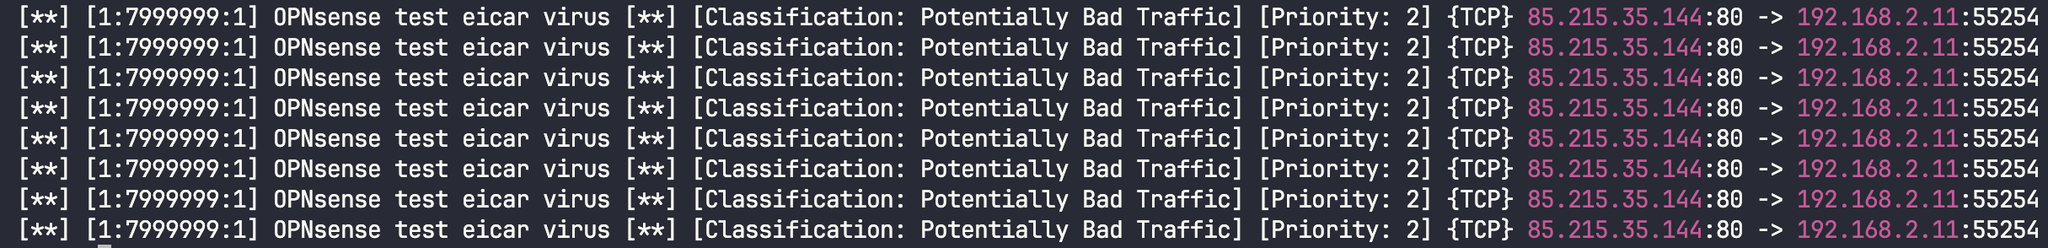
- This is how the alerts look like in fast log format:
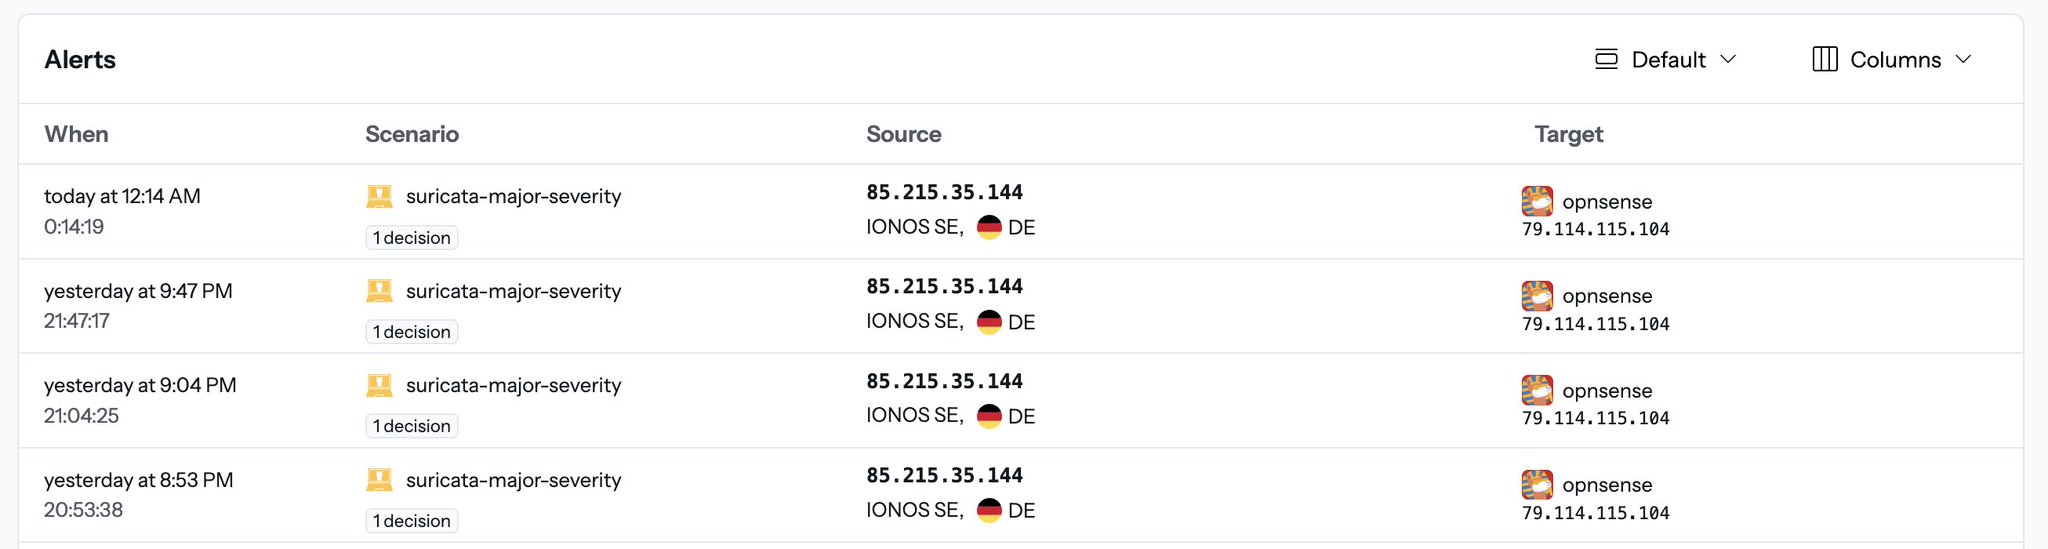
- The alerts from the fast.log are also getting pushed in the Crowdsec Console:
Set Up Pushover Notifications

- Create a Pushover Account: Let’s have the alerts and decisions get pushed via Pushover so we know what is going on without always keeping in eye out for alerts. In order to achieve this, first create a free account at Pushover , install the application on your mobile device and enroll the device. Create a new application for which you will receive the application token.
- Update CrowdSec Profiles:
You will have two tokens, the application token which you have just created and the user token. You will need them both for the integration. Add the following configuration to:
- /user/local/etc/crowdsec/profiles.yaml
name: default_ip_remediation
#debug: true
filters:
 - Alert.Remediation == true && Alert.GetScope() == "Ip"
decisions:
 - type: ban
   duration: 4h
#duration_expr: Sprintf('%dh', (GetDecisionsCount(Alert.GetValue()) + 1) * 4)
notifications:
 - http_default   # Set the required http parameters in /etc/crowdsec/notifications/http.yaml before enabling this.
on_success: break
---
name: default_range_remediation
#debug: true
filters:
 - Alert.Remediation == true && Alert.GetScope() == "Range"
decisions:
 - type: ban
   duration: 4h
#duration_expr: Sprintf('%dh', (GetDecisionsCount(Alert.GetValue()) + 1) * 4)
notifications:
 - http_default   # Set the required http parameters in /etc/crowdsec/notifications/http.yaml before enabling this.
on_success: break
- Configure HTTP Notifications:
Add the following configuration to
- /usr/local/etc/crowdsec/notifications/http.yaml
#########################################################################
# Title:            CrowdSec : Pushover Notification (API)              #
# Author(s):        JigSawFr                                            #
# URL:              https://github.com/crowdsecurity/crowdsec           #
#########################################################################
#                             MIT License                               #
#########################################################################

type: http          # Don't change
name: http_default  # Must match the registered plugin in the profile

# One of "trace", "debug", "info", "warn", "error", "off"
log_level: info

# group_wait:         # Time to wait collecting alerts before relaying a message to this plugin, eg "30s"
# group_threshold:    # Amount of alerts that triggers a message before <group_wait> has expired, eg "10"
# max_retry:          # Number of attempts to relay messages to plugins in case of error
# timeout:            # Time to wait for response from the plugin before considering the attempt a failure, eg "10s"

#-------------------------
# plugin-specific options

# The following template receives a list of models.Alert objects
# The output goes in the http request body
format: |
  {
   "token": "replace with application token",
   "user": "replace with user token",
   "message": "{{range . -}}{{$alert := . -}}{{range .Decisions -}}<b>{{.Value}}</b> will get <b>{{.Type}}</b> for next <b>{{.Duration}}</b> for triggering <b>{{.Scenario}}</b>.\r\n https://www.shodan.io/host/{{.Value}}{{end -}}{{end -}}",
   "html": "1",
   "title": "Scenario triggered on IDS/IPS !"
  }

url: https://api.pushover.net/1/messages.json

method: POST
headers:
  Content-Type: "application/json"
Testing
After the following modifications restart the service with sudo service crowdsec restart and you are good to go. Any new notification should be received on your mobile device. The alerts from what I have tested are instantaneous and this is how the notifications will look on you mobile device.
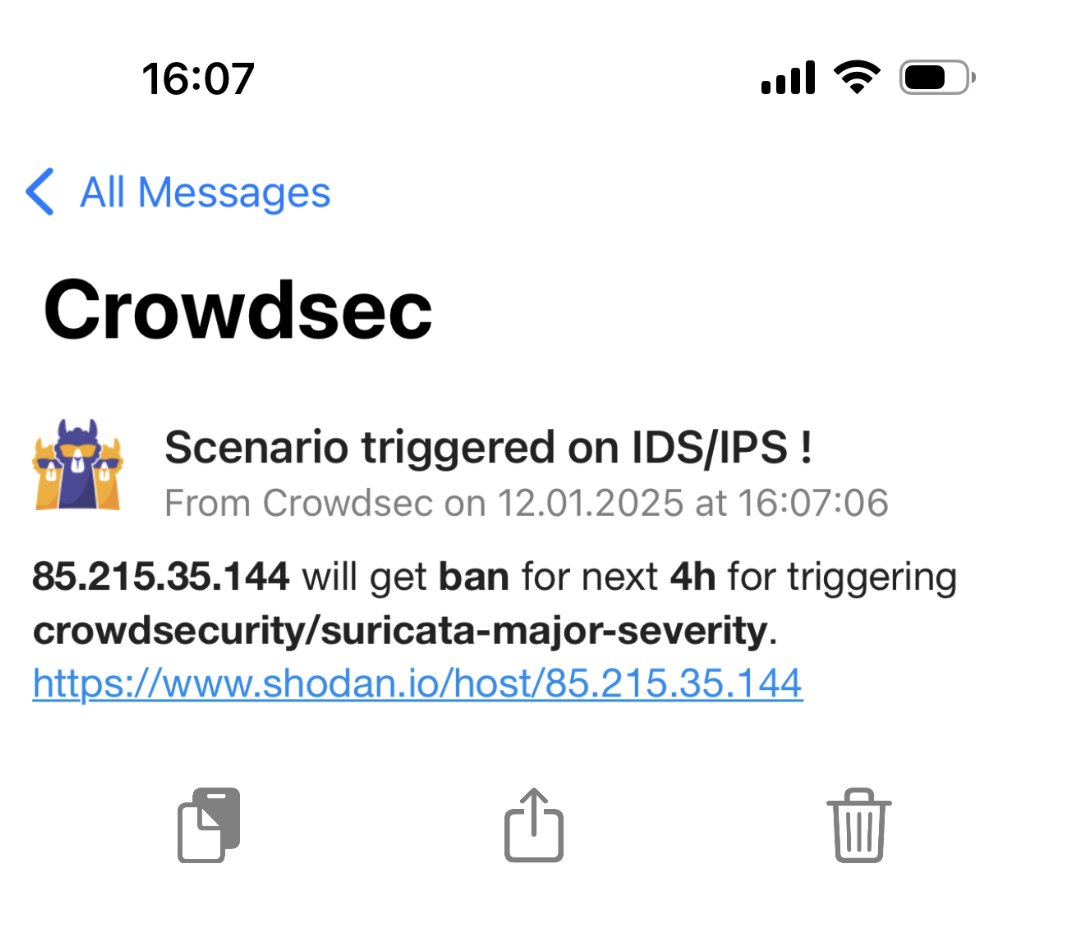
The Shodan.io let’s you do further manual checks if needed. You can also add other websites for easy and fast checks like Virustotal.com The below line needs to be modified if you want to add other websites to check the status of the IP that has been blocked:
"message": "{{range . -}}{{$alert := . -}}{{range .Decisions -}}<b>{{.Value}}</b> will get <b>{{.Type}}</b> for next <b>{{.Duration}}</b> for triggering <b>{{.Scenario}}</b>.\r\n https://www.shodan.io/host/{{.Value}} \r\n https://www.virustotal.com/gui/ip-address/{{.Value}}{{end -}}{{end -}}"
Please let me know if this has worked for you by dropping a comment or texting me.